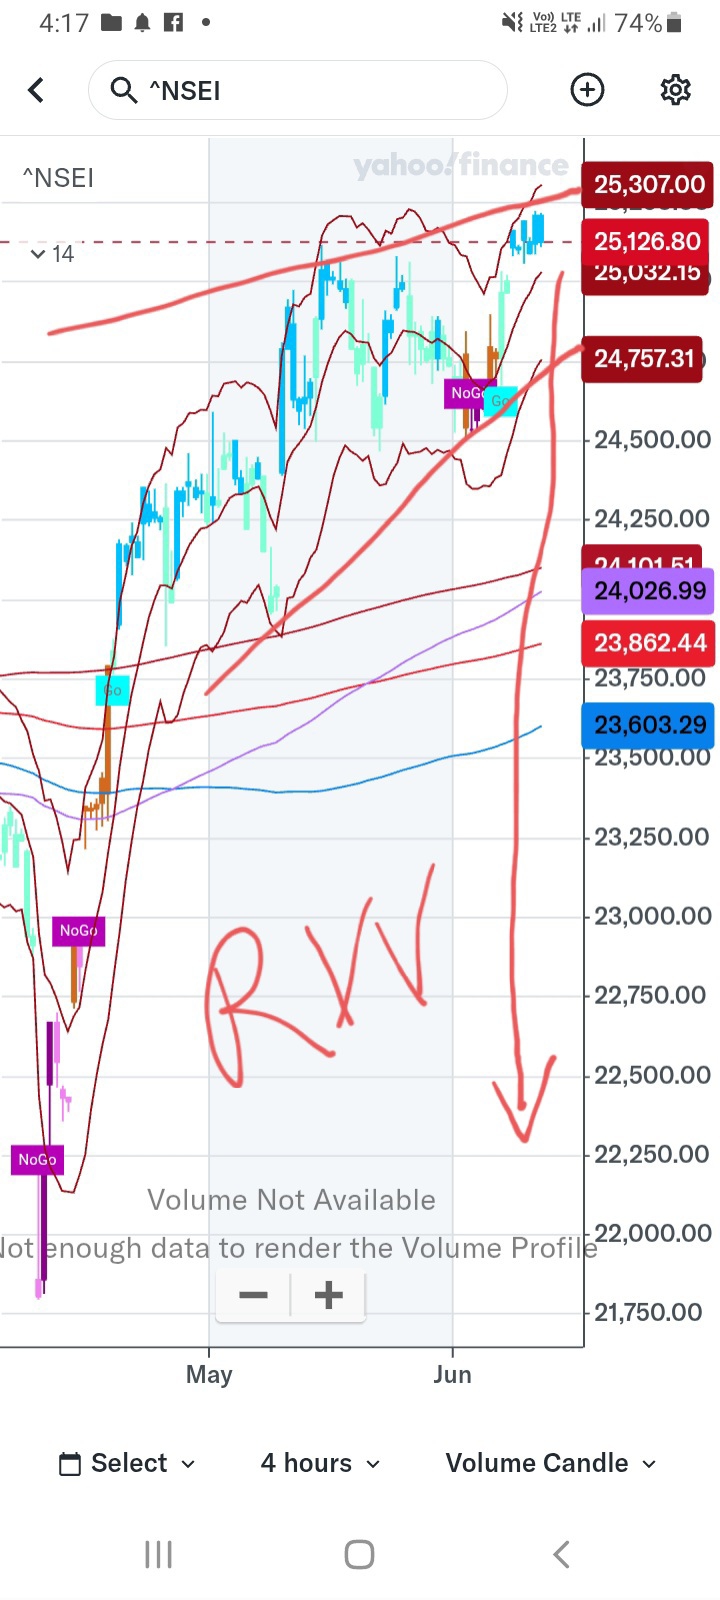
Nifty 24720 , - 280
Gann level
22900 < 23250 < 23650 < 24000 < 24400 < 24800 > 25200 > 25600
Long term sup 22400, 21300, 20400
Sup 21600, 21700
Sup 22600, 800,900,23500
*on13 june, breakdown on rising wedge pattern started since april end
* sell signal on 15 min chart on 9 june closing hour
* monthly sell sl 25200 intact
*weekly sell since may third week
* monthly red candle started,
* last month of quarter, close below 23400 in june for red candle


No comments:
Post a Comment